Evaluation: get insight in usage statistics (Statistics menu)

Response rate
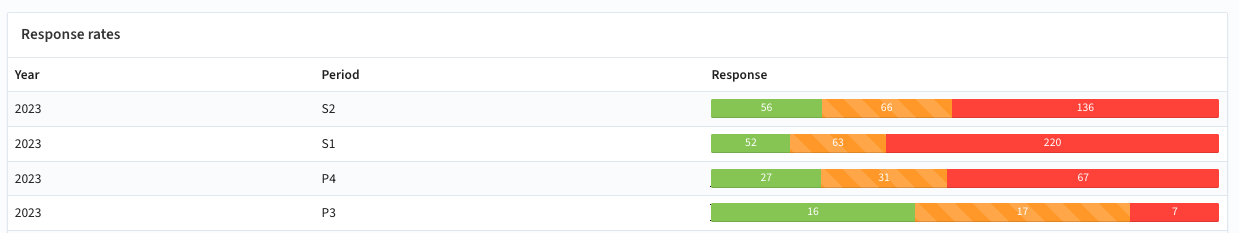
The Statistics -> Response rate option opens an overview of the combined periodic response rates.
After selecting the menu option the report of response rates is shown.
The information shown is the number of participants that are invited to an evaluation in a specific year and period.
The bar with response shows the number of participants and their status:
- Red: participants have received an invite or are planned to receive an invite (upcoming period) but have not (yet) started the evaluation
- Orange: participants have started the evaluation, but have not submitted the result
- Green: participants have submitted the evaluation.
Participation
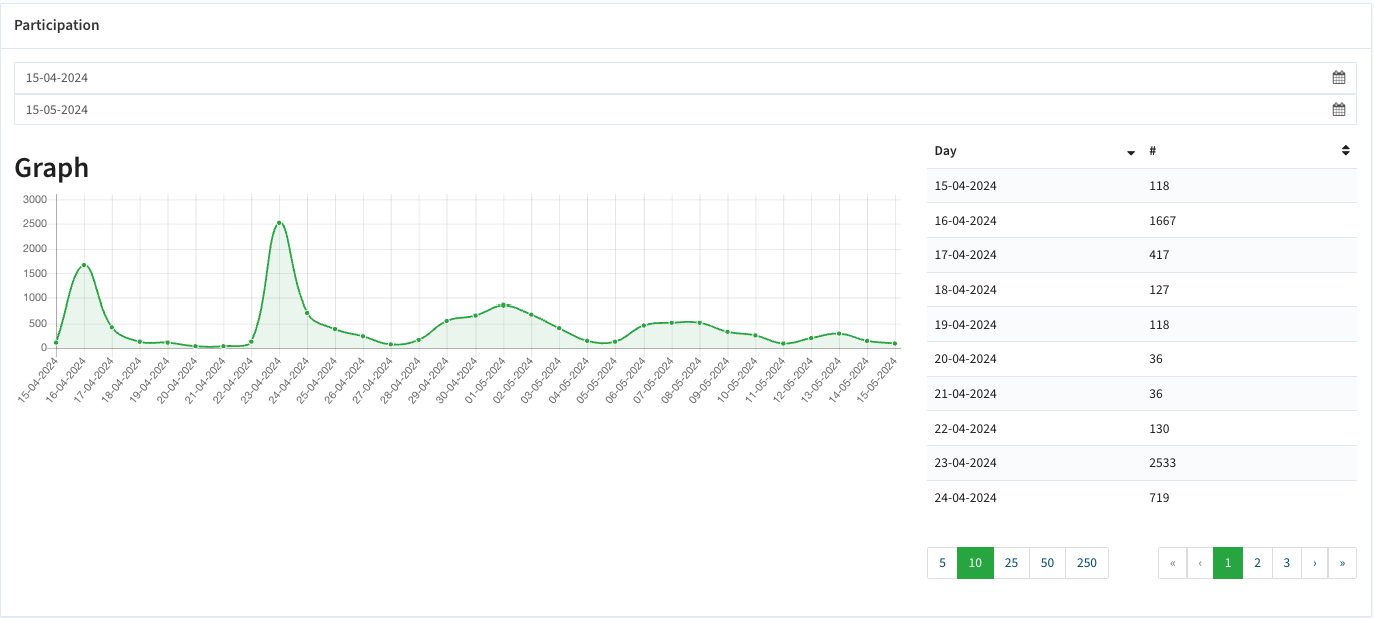
The Statistics -> Participants option opens an overview of the number of participants in the given period.
After selecting the menu option the report of participants is shown.
Uses the dates to define the required start and end date.
Signed-in users (daily use rate)
The Statistics -> Signed-in users option opens an overview of the number of users (staff) that used the system in the given period.
After selecting the menu option the report of participants is shown.
Uses the dates to define the required start and end date.
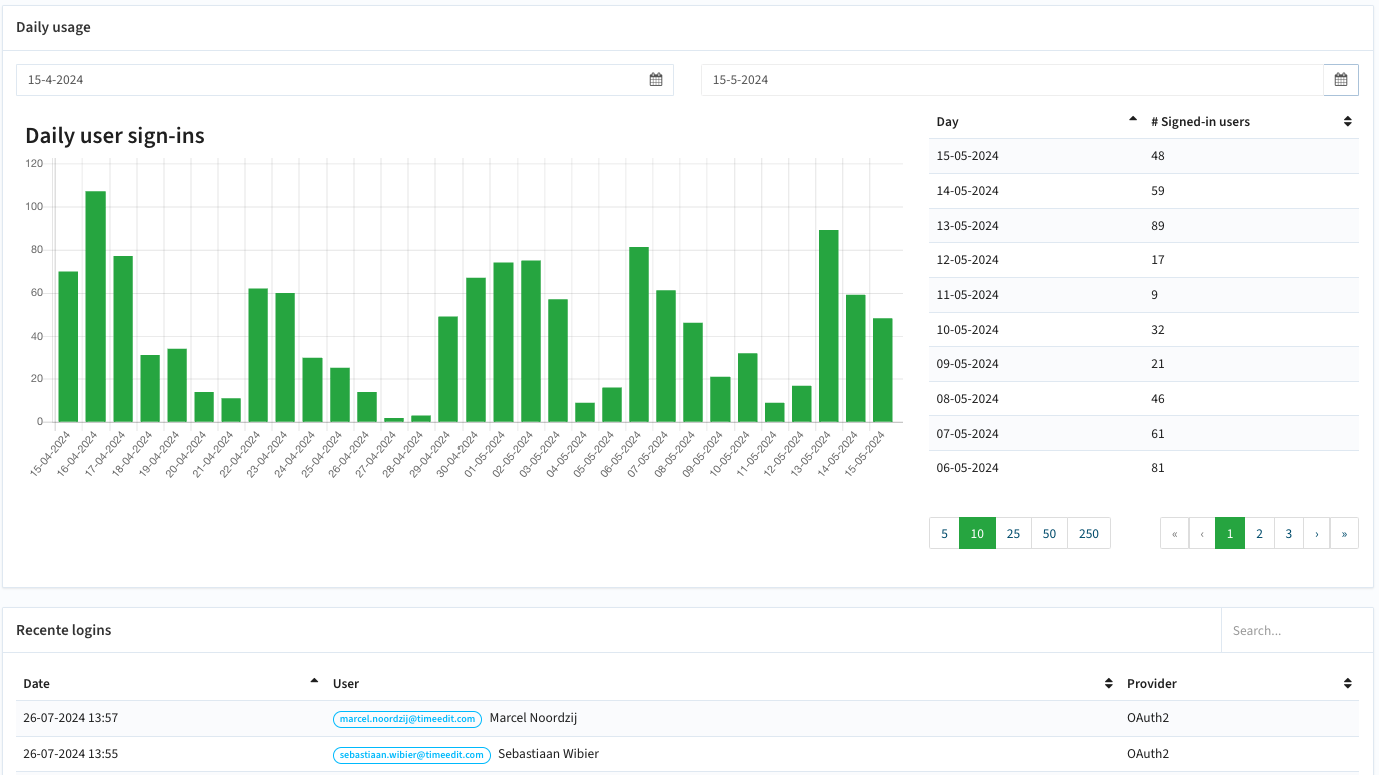
Underneath the graphic, a list is provided with an overview of the individual logins.
Benchmarks
The Statistics -> Benchmarks option opens an overview of all questions and their calculated average response per period.
After selecting the menu option the report of response rates is shown.
Filter the report on:
- Question: the question ID
- Type: the evaluation type
- Period: the period the evaluation is offered
The example below provides the benchmark (average) results for a given period over time.
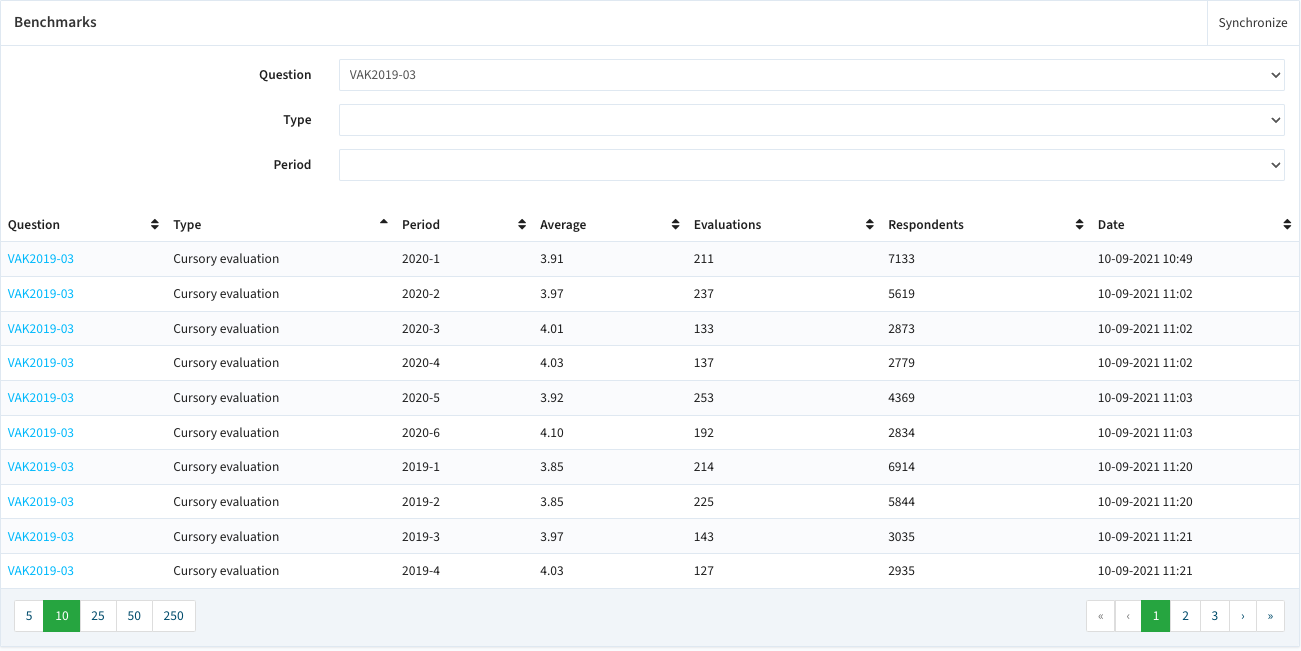
The reports provides insight in:
- Question: the unique ID of the question
- Type: the evaluation type the question is asked
- Period: the period the evaluation is offered
- Average: the benchmark value for this question in the evaluation
- Evaluations: the number of respondents
- Respondents: the total number of invited respondents
- Date: the date the average is calculated for the last time