Evaluation: configure reports (Templates -> Report menu)
Evaluation supports extensive reporting options on the evaluation results for users. Users will use pre-configured reporting templates to report on the evaluation results. Since evaluation data can be sensitive, part of the report template configuration is configuring the different reports for the different stakeholders and adding the proper authentication results to prevent stakeholders seeing data they are not allowed to see.

Define the report template basics
Report templates are used to define and configure the different reports available for users. These reports may vary in format, data shown, target stakeholder(s), etc.
Setting up a template consists of a number of steps, where in this manual each section covers a step in the configuration process.
A typical installation may have tens till hundred different templates,
depending on the number of evaluation types and
distinction in reports between the different stakeholders.
The Templates -> Reports option opens an overview of all defined reports in Evaluation.
Use the pull-down to select the evaluation type for filtering on reports shown.

Click on Create to define a new report template or on an existing to edit the report template.
The first step in the definition is setting up the general report template behaviour:
- Evaluation type: Defines the default evaluation type this report template is intended for.
- Type: Indicates the report type, e.g. the behaviour:
- standard evaluation - the block is shown once in the evaluation
- member evaluation - the block is shown as a person (lecturer) select and will open the lecturer oriented questions for each selected lecturer
- External ID: Unique external ID, used for integration scenarios
- Name: The name of the report template, shown as header of the report and in select report drop-downs to the user
- Start date: The date from which this report will be made available in the system
- End date: The date till which this report will be available in the system
- Cards view: Display type where answers to a questions are nicely grouped and contained in a visual bordered box
- Show blocks: Show the questions grouped by block, as defined in the evaluation template and used in respondent date entry (view)
- Only show templates: Only show questions that are defined in the evaluation template, thus skip all 'extra questions' added by the coordinator for a specific evaluation.
- Show empty options: Show results for 'closed questions' that have no result in the calculations.
- Show benchmarks: Show the benchmark for the evaluation / question compared to previous evaluations.
- Feedback editable: Enables editing the feedback directly in the report. Especially used for the External Examiner process
- Number questions per block: The maximum number of questions reported per block
- Show feedback last: Default the feedback is shown at the top of the report. This option will move the feedback from the top to the bottom of the report.
The example below shows an example configuration of a Management report.

The configuration of the general report template behaviour continuous:
- Minimal number of participants: The minimal number of respondents needed to run the report.
This to prevent showing or generating reports with only a very limited number of respondents (e.g. 1 or 2) - Avg. grade questions: indicate which questions are included in the average grade.
- Include previous years (#): In case an evaluation has not enough respondents, but is similar to evaluations done in previous years, the results from # previous years will be used to get past the minimal number of respondents. Useful for study graduation evaluations with limited respondents per year,
- Sequence: Define the default order in lists and menus the report is shown.
- Type of participants to include: Choose which participants should be included in the report:
- Finished - respondent has finished and submitted the evaluation
- Not started - respondent has not opened the evaluation
- Started - respondent has opened the evaluation, may have answered anywhere between 0 and all answers but hasn't submitted the evaluation.
Adding 'started' can be useful for increasing the number of participants for the first couple of questions.
- Block types: Defines which block types should be included in the report.
- Member evaluations are evaluations on persons (lecturers) and are more confidential.
- Standard evaluations are all other evaluations.
- Only show own evaluations: Defines if in case of a member evaluation only the results from the logged in user are shown, or the results of all evaluated lecturers.
The example below shows the further definition of the Management report.

The edit screen supports the following options:

- Preview: Preview the configured report
- Copy: Create a copy of the template (configuration of basic details and settings)
- Delete: Delete the template
- Cancel: Cancel the made changes. Is the same behaviour as Save and select the option 'don't save'
- Save: Save the changes made
Benchmark configuration
Benchmarks are used to validate evaluation results to pre-set values. Next to pre-set values benchmarks can also be configured against a benchmark based on evaluation results in a specific period and based on a specific filter, e.g. faculty.
The resulting reports looks like the following images, where in case the benchmark is configured:
- the deviation from the institution average for the selected evaluation is shown
- the deviation from the filtered value (e.g. faculty) for the selected evaluation is shown


The report can be exported in an Excel or CSV format, where the 3 values in the report shown in 'one cell' are spread over separate columns.

Configuration
The first step to configure the usage of a filter-based benchmark, navigate to the Admin -> Parameters page and configure the filter value to be used as benchmark tag.

The next step is to configure which questions should be benchmarked. This is done by setting the Benchmark from and Benchmark to dates on the relevant questions.

The final step is to navigate to Statistics -> Benchmarks. This provides an overview of all questions and their calculated benchmarks.
In case there are no benchmarks shown, maybe due to the fact the benchmark is just enable on a question, click the synchronize button to start re-calculation of the benchmarks.

Participant sums (filter on tags)
A participant sum configures the respondent related added (tag) information should be shown in the report, as explained with an example below.
Click on the tab participant sums, the list of defined tags to be available for filtering the report is shown.

Click on Create to define a new tag based filter or click on an existing to edit the defined filter
The configuration requires/supports:
- Label: Defines the name (label) of the filter on participant information as shown in the report
- Name: Select the filter from the list of defined filters under the menu option Admin -> Elements
- Filter value: The sub filter to used.
- Filter value (optional): Optional filter value, used to filter all respondents that meet the defined participant sum configuration.
E.g. filter all evaluation results from male respondents. - Rewrite rules: Rewrite rules are used to map the preconfigured 'code(s)' of a specific response to a new code.The example below shows an extension to the above shown filter on gender that shows a filter and two of the results as filtered value.The newly added filter is the students that have not a M or F gender, but have an U or X. By rewriting the U to X, both X and U are grouped together as Other (X).
The example below shows an example configuration of a tag-based filter.

Member types (role based access)
The member types are the roles that will have access to the defined report template.
Click on the tab member types, the list of defined roles and their acces to the report is shown.
The configuration requires/supports:
- Member type: Select the member type from the list of defined types under the menu option Workflow -> Member types.
- Show member: Defines if the assigned person(s) for this role will be shown at the bottom of the report
- Show feedback: Defines if the feedback sent to that member is included in the report.
Feedback sent to the students is always included in the report. - Access: Defines the access to the report for the member type (role):
- None - No access
- Show only responsible - Only access to the person that has been assigned to this role in the evaluation
- Show responsible and colleagues - Access to all employees that have this role in the system.
The example below shows an example configuration of member types.

Table header
The table header is used to define a 'generic table' configuration in the template used only for closed questions with the same type.
Click on the tab table header, the list of defined header for the report is shown.
The configuration requires/supports:
- Label: The header value shown in the report header.
- Values: The response values that are combined in the column defined by the header.
The example below shows an example configuration of a table header that transforms a 5-point scale to a 3-point report.

Filter questions (to be shown in the report)
The next step is to define the questions to be shown in the report. The filter questions is only used for specific reports that should exclude specific questions.
The next section will explain how to configure the questions to be shown on type, which means the filter questions will not be needed.
Click on the tab filter questions, the list of defined questions for the report is shown.
The image below shows the default setting with no questions selected.
Select the 'Enable filtering of questions' option to start configuration of the questions supported.The option will appear to indicate if the open questions should be displayed in order of appearance or bundled at the bottom of the report (readable).

The configuration requires/supports:
- Enable filtering of questions: Configure if filtering of questions should be applied for this report template
- Open questions order: Define the order the questions are shown in the report:
- In order - the questions are shown in the order they are defined in the selected list of questions
- Readable - the questions will be first grouped on type to get a more easy to interpret report. The Likert scale questions are shown in one table overview, where the open text questions are put at the bottom and not intermixed with the order question types.

The final step is to select the questions that should be added to the report.
Click on Create the start selecting the questions.
The filter / search options to find the desired questions are:
- Evaluation: search for a template to be used as the foundation of the questions to select
- Evaluation template: select an evaluation template to get a list of available questions within the context of a specific evaluation type / definition to filter on.
- Tags: optional add tags to restrict the search
- Text: search for questions by typing a part of the question text
Select the questions to be added to the report.

The result is a report configuration that will only contain the defined/selected questions.

Question types (to only show questions of a specific type)
The question type tab is used to define what question types will be shown in the report and how they will be displayed.
In this case no questions are specifically added, but the report will be generated based on question type, e.g. only closed questions, or only Likert scale questions.
Click on the tab question type to open the configuration.
Each question type is shown, it's just selecting if the type should be shown and if so how it should be shown.

The supported visualisation options are:
- <blank> - question of this type will not be available in the report
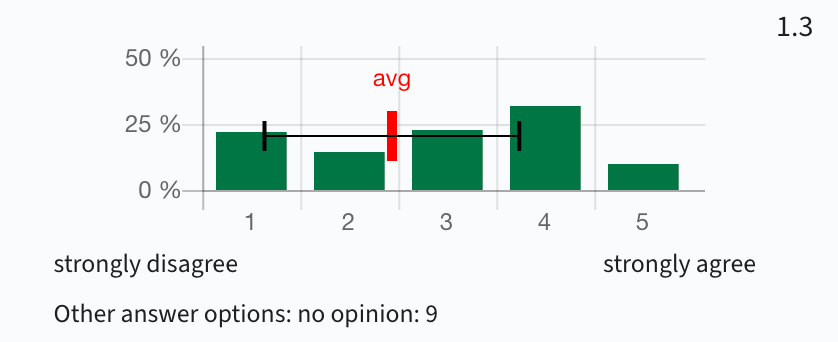
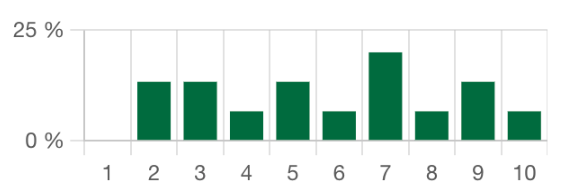
- Graph - answers are shown in a graphical manner
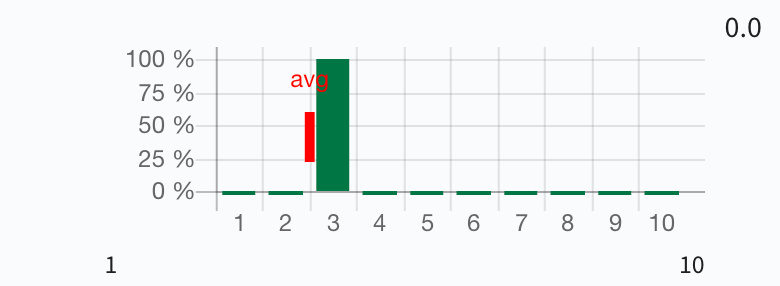
- Histogram - answers are shown in a histogram, including a standard deviation
- Histogram without average - answers are shown in a histogram
- In table - answers are shown in a table view. The questions marked as 'in table' will adhere to the settings configured in the 'Table header'-tab.
- Text - alle individual answers will be shown as one single text underneath the questions.
- Text bullets - all individual answers are separately listed in the report. This option is used to report all answers to an open question.


Attributes (define additional report values)
An attribute is used to add report items to a report that are not directly based on answers to individual questions.
Attributes can be a combination of standard available options, or be based on so-called meta data using the defined elements.
The attribute tab is used to define the attributes to be shown in the report.
Click on the tab attribute tabs to open the configuration.
Either use the Add-button to define a new attribute to be shown, or modify an existing one.
The attribute to show can be selected from a list that contains the configured attributes in the system.
It is possible to add the following attributes:
- Respondents (%): Calculation of all respondents and finished respondents
- Success rate course: Requires exchange of a Tag that will provide course information for the respondents to calculate the % that started and finished the course
- Success rate exam: Requires exchange of a Tag that will provide grade information for the respondents to calculate the % that started and finished the exam
- Attention points: Calculation based on questions marked for attention if the result (benchmark value) is too low.
- Average grade: : Requires exchange of a Tag that will provide grade information for the respondents to calculate the average grade
- Registration count: The total number of students that started the evaluation
- Registration without marks (%): The number of students that started the evaluation, without a grade for the Exam. Requires exchange of grade information.
The example below will add three attributes to the report:
- the number of respondents invited to fill out the evaluation
- the percentage of respondents that finished the evaluation
- the % of students that successfully finished the course (e.g. got a sufficient grade)

User reporting export options
The users can use the configure report templates to report on their evaluations.
Default reports are shown on screen as interactive reports, that allow filtering on the defined tags and given answers.
Reports can also be exported into different formats, so the report can also be used outside Evaluate.
The image below shows the different options. Besides the options, the user can choose to generate a ZIP (compressed file) in case a larger amount of reports is selected for export.
Depending on the number of selected reports, Evaluate will auto-select and force a single ZIP (compressed) result.

Condensed person report
The condensed person report is a new report accessible to all authorised users. The report will provide information on the staff members of a faculty/department and their evaluation results compared to the median and the deviation from the median.
Based on authorisation (access right) and assignment to a faculty a user can retrieve the report. Since the 'report' result is based on right and context the report will be visible and selectable for all users and only after executing the report the result will be generated, either a message 'not allowed' or the 'report with data'.
The report is available in the top-bar menu.

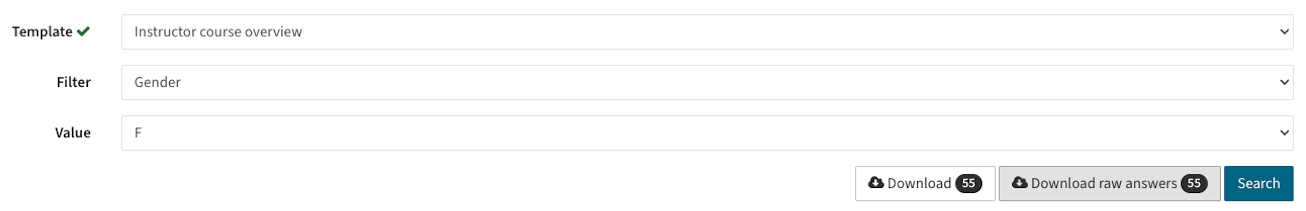
A form appears that allows providing some additional details:
- Template: the reporting template to be used (see later for configuration of the template)
- Filter: the filter to be used for filtering the 'evaluated persons'
- Value: the filter value, e.g.
- Filter = Faculty
- Filter value = Science faculty
- Download: button to download the report result in Excel or CSV format
The result will be a list of staff members that meet the criteria AND the logged in user has rights to access the information for.
The result structure is:
- Person
- Evaluations the person has been evaluated for
- Evaluation result per question defined in the evaluation template
- Evaluations the person has been evaluated for

Configuration steps
1 - Define a role with the report right
The role is optional, but is used to define what right has to be assigned to a role to enable viewing of the report results. The right can be added to a new role, but can also be added to an already existing role.
Open the Workflow menu option and select the Member types sub-menu.
- Select the Periodic evaluations and create a new role Report viewer
- Use the security button to assign the right Access to all reports


Access to all reports
2 - Assign the authorisation
Open the Admin menu option and select the Relations sub-menu.
Select the Periodic evaluations and assign the created rol of Report viewer to the relevant persons.

3 - Define the report template
Open the Templates menu option and select the Reports sub-menu.
Select the Periodic evaluations and define/modify the template for the condensed lecturer report.

The next step is the configuration of the report template. This is just the standard configuration where the questions to be used in the report are defined.
The checkbox Only show your own evaluations has to be checked and defines the condensed report is grouped on a person level and thus the condensed lecturer report.

Specific member report export option
The member report provides 'combined / calculated' average, median and deviant results for the question responses. A specific option is added to the report to export the 'raw answers' that without any calculation. This has been added as a separate button, so the export supports both the calculated results and the export with the raw results.